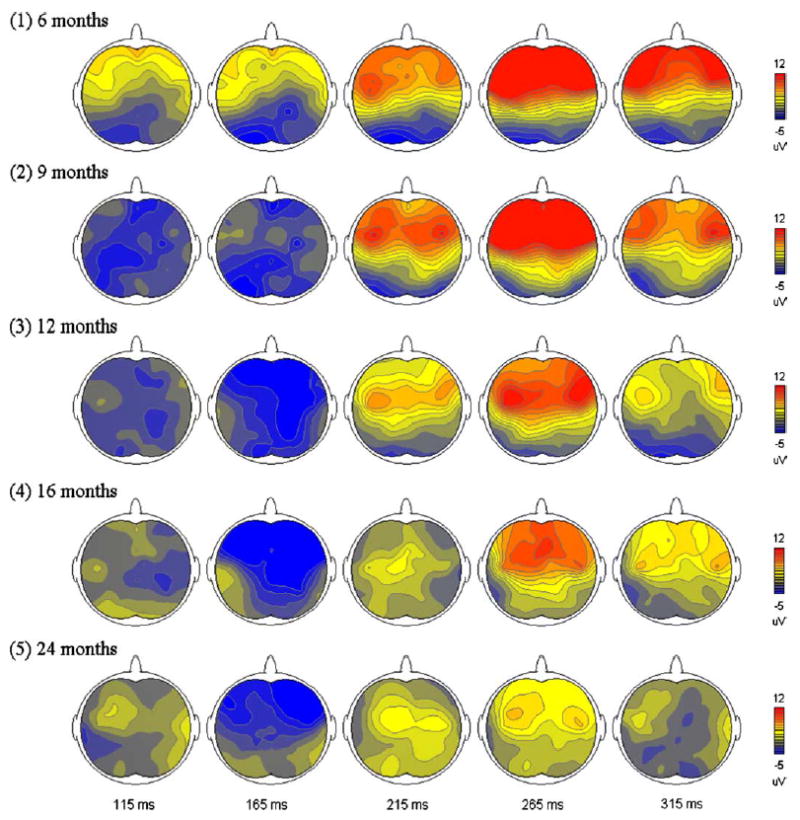
Fig. 5.

Amplitude scalp distributions of mismatch responses. Brain areas of higher amplitudes are shown in red, whereas those in lower amplitudes are in blue. The data were calculated from all subjects. (For interpretation of the reference to color in this legend, the reader is referred to the web version of this article.)
