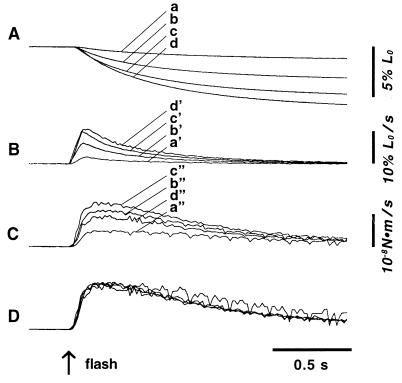
Figure 2.
Typical fiber length (A), shortening velocity (B), and power output (C) changes in the early phase of fiber shortening against four different values of Cauxo. Length records a, b, c, and d correspond to velocity records a′, b′, c′, and d′ and to power output records a", b", c", and d", respectively. Normalized power output records relative to the peak values attained are shown in D. The records are the same as those shown in Fig. 1.

