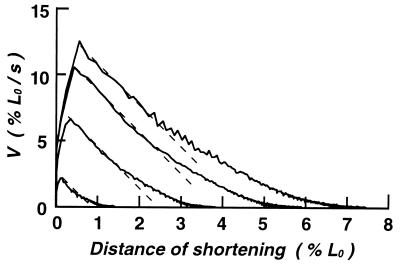
Figure 3.
Relation between velocity V and the distance of fiber shortening x at four different values of Cauxo. The records used are the same as those shown in Figs. 1 and 2. Broken lines indicate that, after reaching a peak, V decreases linearly with x with the same slope irrespective of the value of Cauxo.

