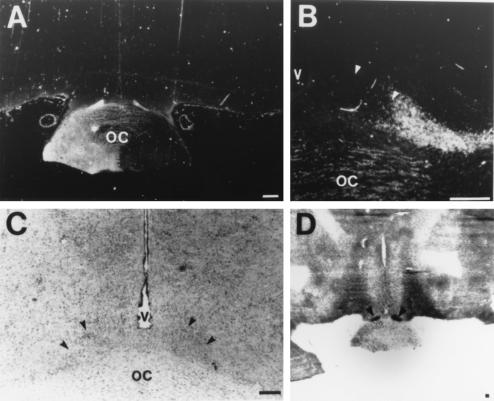
Figure 3.
Innervation of the SCN by the retinohypothalamic tract. (A) Low-power image of CT-HRP labeling of the optic chiasm. (B) Adjacent tissue section stained for Nissl substance. (C) High power image of CT-HRP labeling of SCN contralateral to injection. (D) Autoradiographic image generated from DG study. Arrows identify the SCN. (Bars = 1 mm in A and D; 50 μm in B and C.)

