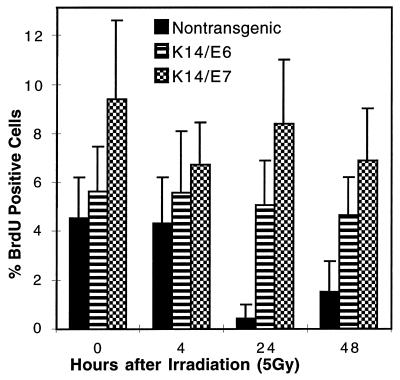
Figure 2.
Time course of changes of BrdUrd-positive cells in the epidermis of nontransgenic and E6- and E7-transgenic epidermis treatment with radiation (5 Gy). Graphed are the average percentage of epidermal cells positively stained for BrdUrd at different times after treatment. Error bars indicate standard deviation (SD) among samples from three different mice.

