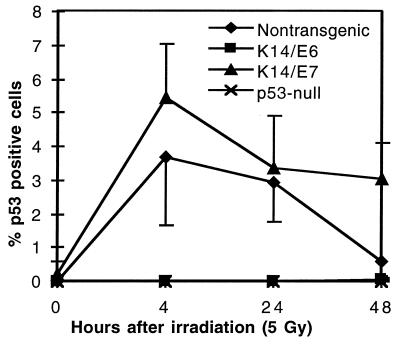
Figure 5.
Quantification of p53-positive cells in the epidermis of nontransgenic (♦), E6-transgenic (▪), E7-transgenic (▴), and p53-null (×) epidermis after treatment with radiation. Graphed are the mean percentage of epidermal cells positively stained for p53 at different times after treatment of mice with 5 Gy of radiation. Error bars indicate SD among samples from different mice.

