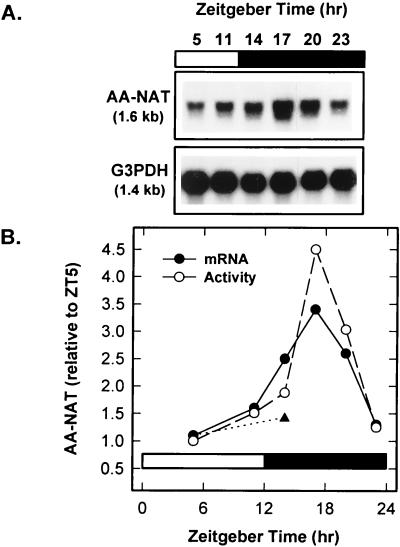
Figure 1.
Daily rhythm in AA-NAT mRNA and activity. Dissociated pineal cells from 1-day-old chicks were cultured for 5 days in a light cycle (LR 12:12, white light on at ZT 0) and were harvested at the indicated times. The filled bar indicates when white light was off. (A) Representative Northern blot analysis of AA-NAT and GAPDH (G3PDH) mRNAs (20 μg total RNA per lane). For each time point, total RNA was prepared from two groups of ≈6 × 10⁶ cells. (B) Quantitative analysis of the Northern blot, after normalization to the GAPDH signal (•). The symbol ▴ shows the levels of AA-NAT mRNA in cells cultured with 5 μg/ml actinomycin D between ZT 11 and ZT 14. AA-NAT activity was measured at each time point (○). All values (mRNA and activity) represent the mean of duplicate determinations and are expressed relative to the ZT 5 time point. Similar results were obtained in four separate experiments.

