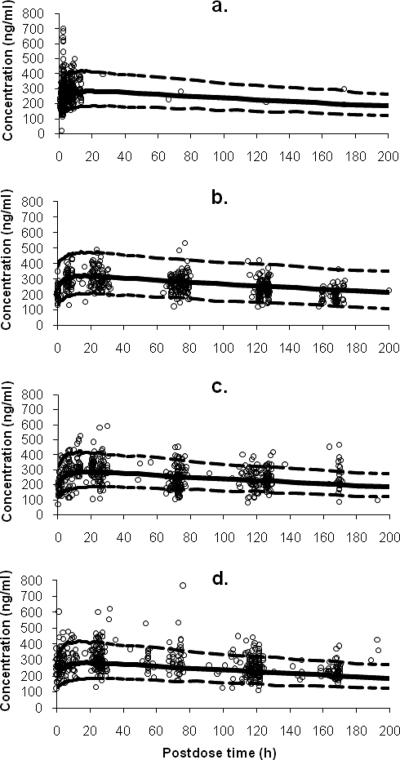
FIG. 2.
Degenerate visual predictive check of the final population model for tafenoquine. Plots are shown for plasma tafenoquine concentration versus postdose time in sampling windows of (a) week 1 (post-loading dose), (b) week 4, (c) week 8, and (d) week 16. The population-predicted profile (50th percentile) is shown by the solid line, and the 90% prediction intervals estimated from 1,000 simulated concentrations over 200 h (postdose) are encompassed by the broken lines in each plot.

