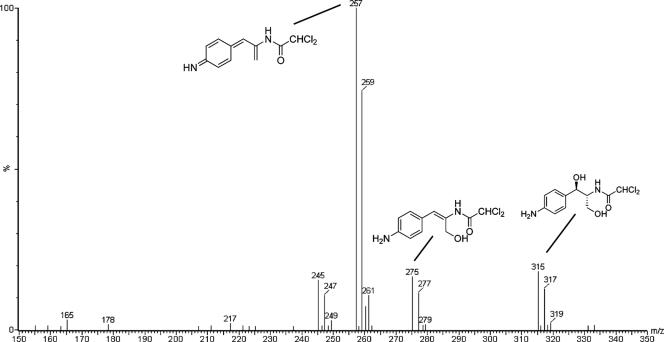
FIG. 7.
ESI spectrum of the ethyl acetate extract of the large-scale production showing the presence of the [M + H]+ for the iminoquinone (m/z 257), the allylic alcohol (m/z 275), and the [M + Na]+ for the 1,3-diol (m/z 315). For clarity, proposed structures are shown as the corresponding neutral species.

