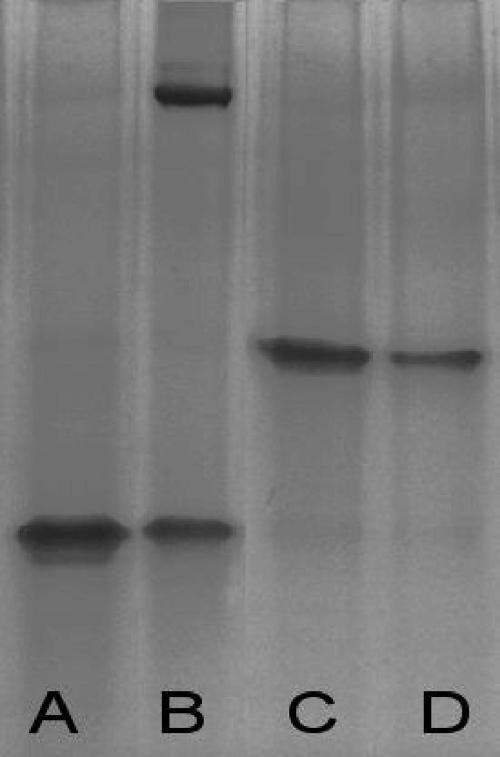
FIG. 2.
Gel mobility shift assay. Lane A, LF; lane B, PA63 plus LF, showing the LT (upper band) and LF in excess (lower band); lane C, LF plus 2LF, showing only the complexes; lane D, LF plus PA63 plus 2LF, showing only the LF-2LF complexes and no LT. Control lanes with PA only or scFv only showed no band; PA probably formed aggregates and did not enter the gel, and 2LF migrated with the migration front (data not shown).

