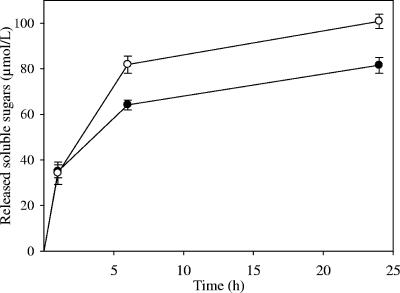
FIG. 2.
Kinetics of crystalline cellulose degradation by 6A and 6At. Curves are labeled as follows: wild-type 6A, ○; engineered 6At, •. The final protein concentration in this and the subsequent figures was 0.1 μmol/liter. Released soluble sugars were assayed by the method of Park and Johnson (26). The data are the means of three independent experiments, and the bars indicate the standard deviations.

