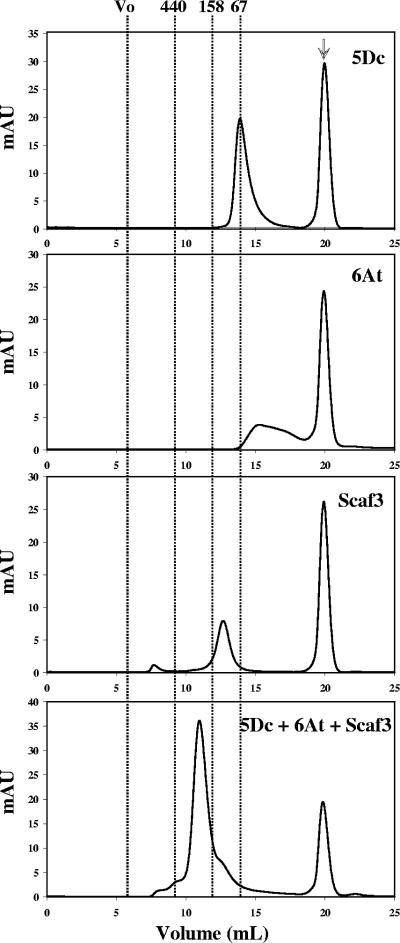
FIG. 7.
Gel filtration analysis of the assembled complex. Injected proteins (100 μl) are indicated on each chromatogram. mAU refers to milliunits of absorbance at 280 nm. Vertical lines indicate the positions of the following molecular mass markers: blue dextran (Vo), >2 MDa; ferritin, 440 kDa; aldolase, 158 kDa; bovine serum albumin, 67 kDa. For each chromatogram, the indicated proteins were at 10 μmol/liter. The peak observed at 20 ml (arrow) in all of the chromatograms corresponds to the maleic acid contained of the sample buffer.

