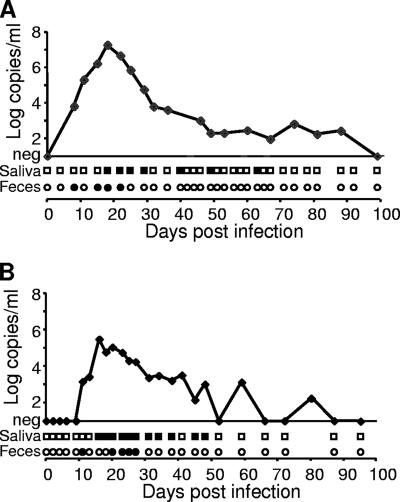
FIG. 1.
Kinetics of “Ca. Mycoplasma turicensis” blood loads (curve in x-y diagram) and shedding patterns in saliva (squares beneath x axes) and feces (circles beneath x axes) in two experimentally infected cats, Cat 1 (A) and Cat 2 (B). Blood loads are given in log copy numbers of DNA template per milliliter of blood (adapted from reference 34 with permission). PCR-positive swabs are indicated by filled symbols; negative swabs are depicted by open symbols. Only the first 100 days p.i. are shown; all swabs collected after 100 days p.i. tested PCR negative.

