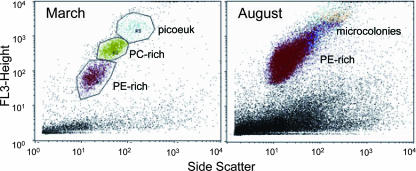
FIG. 8.
Flow cytometry of water samples from station CD1 during late winter (March) and summer (August) 2006. The composition of the APP was determined by pigment fluorescence and is indicated on the plots. Red, PE-rich APP; green, PC-rich APP; blue, picoeukaryotes (picoeuk); and orange, PE-rich microcolonies.

