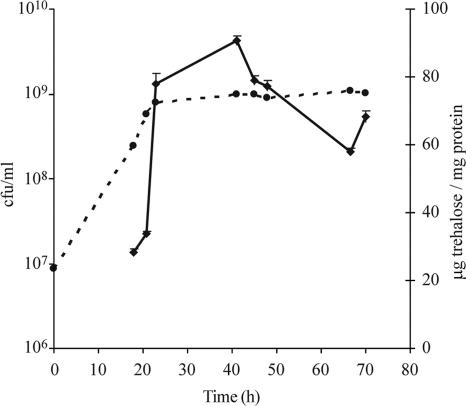
FIG. 1.
Trehalose accumulation by strain NZP561 during the growth cycle. The dashed line shows the growth curve (CFU ml−1) of the culture, and the solid line shows the mean trehalose concentration (μg mg protein−1); the error bars indicate standard errors. The values are the values for two independent samples, each with two replicates.

