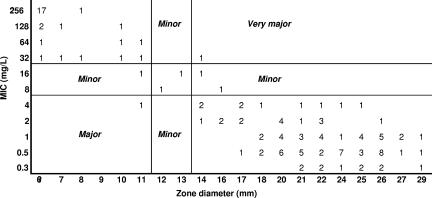
FIG. 4.
“Scattergram” of MICs versus zone diameters. Numbers represent the number of isolates at each MIC/zone diameter pair (e.g., there were 17 isolates whose MICs were ≥256 mg/liter and whose zone diameters were ≤6 mm). (Reprinted from reference 130 with permission of the publisher.)

