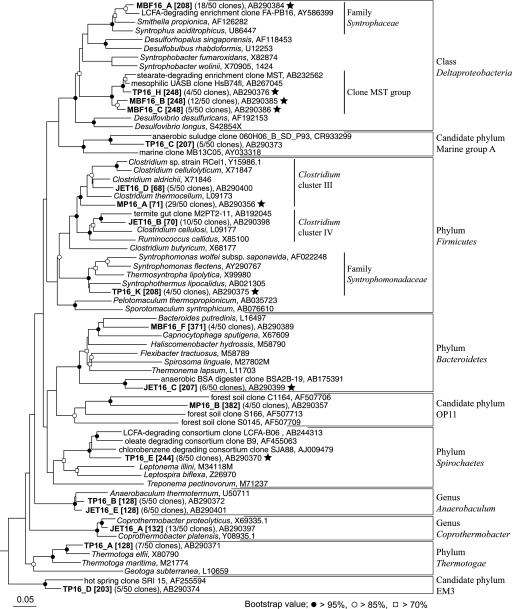
FIG. 3.
Phylogenetic placement of representative bacterial 16S rRNA phylotypes from 13C-labeled RNA fractions. The measured T-RF lengths of phylotypes digested with MspI are shown in brackets. The scale bar represents the number of nucleotide changes per sequence position. The symbols at each branch point show the bootstrap values obtained with resampling analysis (1,000 resamples). Stars indicate putative palmitate degraders inferred from our results. BSA, bovine serum albumin.

