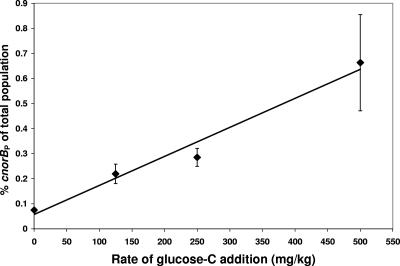
FIG. 4.
Relationship between rate of glucose-C added (mg/kg) to soil microcosms and the size of the cnorBP population as a percentage of total population measured by 16S gene copy number at time 2 days. The line of best fit indicates the linear relationship described by the following equation: y = 0.00116x + 0.0570. Values are means (n = 4) ± standard errors (error bars).

