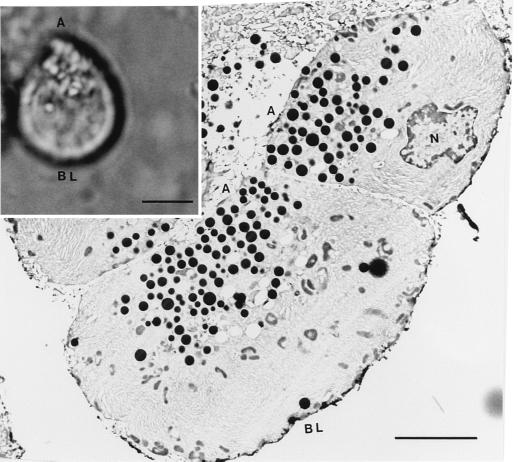
Figure 1.
Rat pancreatic acinar cells seen at the light (Inset) and electron microscope level. The polarity of isolated acinar cells with clearly identifiable apical (A) and basolateral (BL) regions is seen in the differential interference contrast image. The nucleus (N) is present toward the basolateral region, and the zymogen granules (ZGs), ranging in size from 0.1 to 1 μm, are concentrated at the apical end of the cells. (Bar = 5 μm.)

