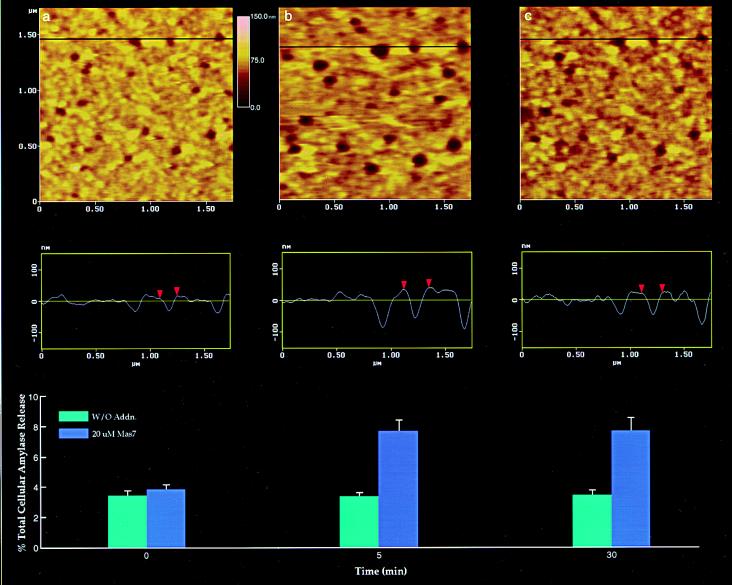
Figure 3.
Dynamics of depressions following stimulation of secretion. (a) Several depressions within a pit are shown. The scan line across three depressions in the top panel is represented graphically in the middle panel and defines the diameter and relative depth of the depressions; the middle depression is represented by red arrowheads. The bottom panel represents % total cellular amylase release in the presence and absence of the secretagogue Mas7. (b) Notice an increase in the depression diameter and relative depth, correlating with an increase in total cellular amylase release at 5 min after stimulation of secretion. (c) At 30 min after stimulation of secretion, there is a decrease in diameter and depth of the depressions and no further increase in amylase release over the 5-min time point. No significant changes in amylase secretion or depression diameter were observed in control acini, in either the presence or the absence of the nonstimulatory mastoparan analogue Mas17, throughout the times examined. High-resolution images of pits and their depressions were obtained before and after stimulation with Mas7, for up to 30 min.

