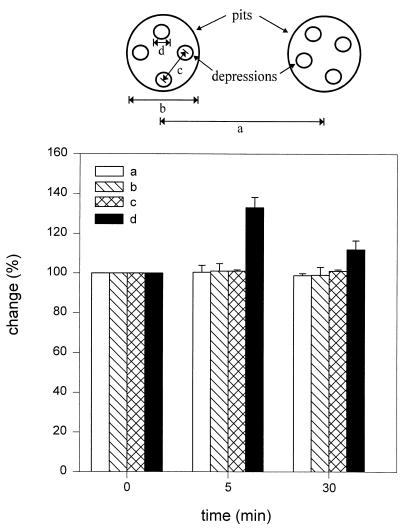
Figure 4.
Changes were observed only in the depressions following stimulation of secretion. An analysis of the dimensions a–d (n = 28), schematically represented at the top and graphically presented below, demonstrates a significant increase (P < 0.001 by paired Student t test) in the depression diameter at 5 min and a return toward prestimulatory levels after 30 min. No changes (100%) in a–c are seen throughout the times examined. Pit and depression diameters were estimated using section analysis software from Digital Instruments. Each single pit or depression was measured twice, once in the scan direction and once at 90° to the first.

