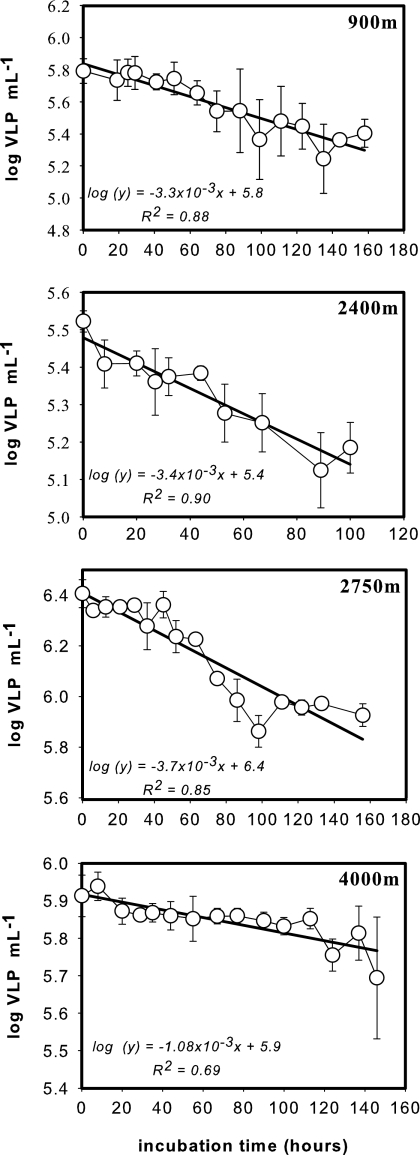
FIG. 3.
Decrease in the abundance of virus-like particles (VLP, log transformed) over time in 0.2-μm-filtered seawater collected at four stations and depths (see Table 2 for locations of stations and basic characteristics of collected water). Symbols represent the means of the viral abundance of triplicate incubations, and vertical lines give the standard deviations (SD). Decay rates (k) were calculated from the slope of the regression line.

