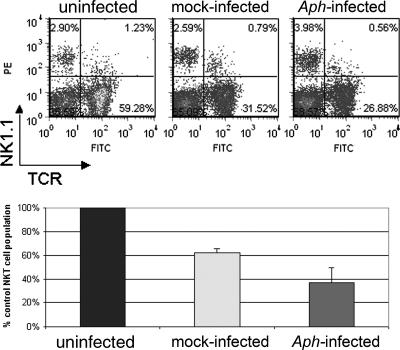
FIG. 4.
NK1.1/TCR expression in splenic lymphocytes of mice infected with A. phagocytophilum or mock infected at 4 days. The top panel shows the two-color flow cytometric distribution of NK1.1- and TCR-expressing cells. The bottom panel shows the reductions in NKT cell populations in mock-infected and A. phagocytophilum-infected mice relative to uninfected mice; the error bars indicate standard deviations. The results shown are representative of three replicates. Aph, A. phagocytophilum.

