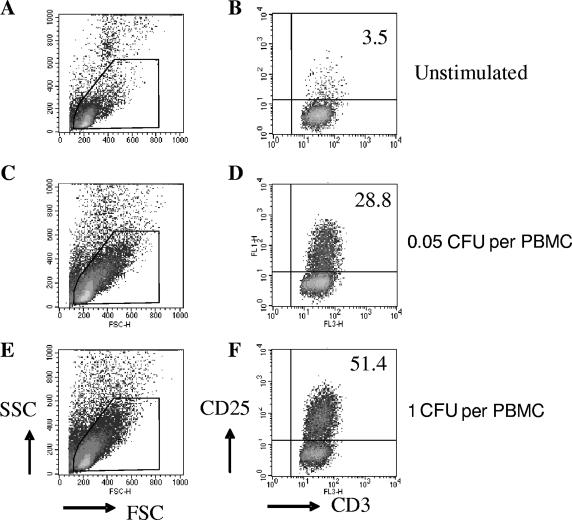
FIG. 1.
Scatter characteristics and CD25 expression in PBMC cultures stimulated with live M. bovis BCG. Cultured cells are shown according to both forward and side light scatter parameters (left). Representative examples from one of the donors tested when cells were cultured in the absence of stimulation (A, B) or in the presence of titrated amounts of Danish 1331 (C to F) are shown. CD3+ cells were selected within the live-lymphocyte gate (R1). Expression of the activation marker CD25 is shown for the CD3+ CD8+ T-cell population (right), with the numbers showing the percentage of CD8+ T cells which were activated.

