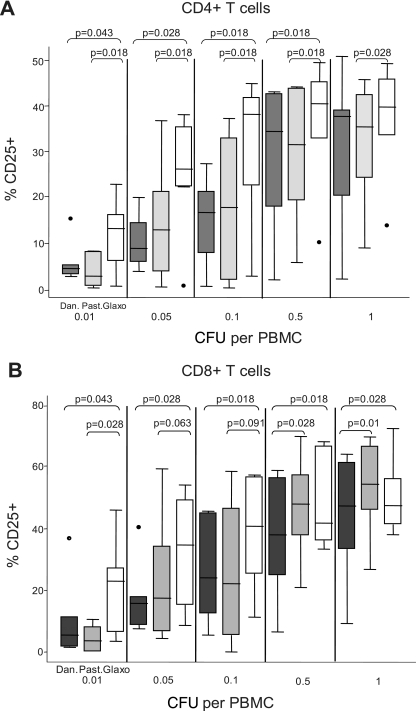
FIG. 2.
CD25 expression induced in vitro by different BCG strains in CD4+ and CD8+ T cells. Percentages of CD4+ (A) and CD8+ (B) T cells expressing the activation marker CD25, as a result of in vitro BCG stimulation, are shown. The horizontal axis is divided into the five BCG doses tested. Within each of the five doses, the results for each of the three BCG strains tested are shown: Danish 1331 (Dan., black), Pasteur 1173 (Past., gray) and Glaxo 1077 (Glaxo, white). Lines within the boxes represent median values. Upper and lower hinges of the boxes represent 75th and 25th percentiles, respectively. Adjacent lines represent the adjacent values, and dots represent outliers. Statistically significant differences (P < 0.05) and borderline differences (0.05 < P < 0.1) between strains are indicated by their Wilcoxon signed-rank test P values.

