FIG. 3.
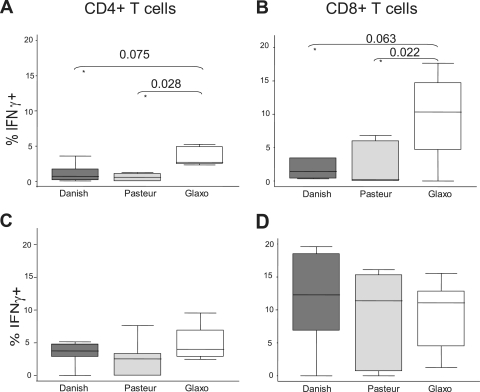
IFN-γ expression induced by BCG stimulation. Percentages of IFN-γ-producing T cells following BCG stimulation with a low dose of 0.01 CFU/PBMC (A, B) or intermediate dose of 0.1 CFU/PBMC (C, D) are shown for the CD4+ (A, C) and CD8+ (B, D) T-cell compartments. The horizontal axes show the three strains tested. Lines within the boxes represent median values, and upper and lower hinges of the boxes represent 75th and 25th percentiles, respectively. Adjacent lines represent adjacent values, and dots represent outliers. Statistically significant differences (P < 0.05) and borderline differences (0.05 < P < 0.1) between strains are indicated by their Wilcoxon signed-rank test P values.

