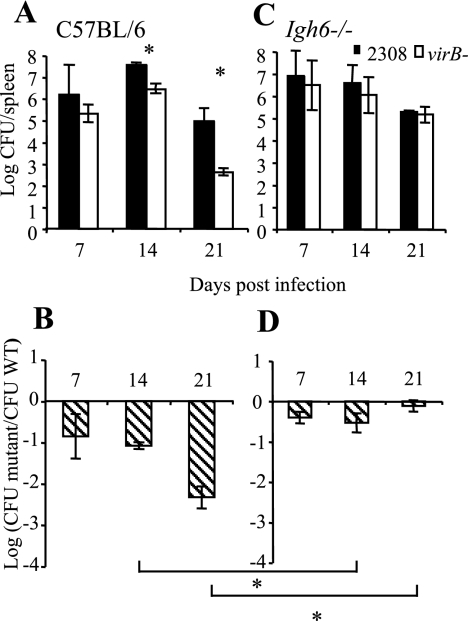
FIG. 8.
Recovery of virB mutant and wild type from spleens of C57BL/6 mice (A and B) and Igh6−/− mice (C and D) after mixed infection. (A and C) Mean CFU of wild-type and virB mutant B. abortus recovered from mice (n = 5). (B and D) Data points are expressed as competitive index (ratio log CFU mutant/log CFU wt) and represent the geometric mean of data from five mice ± the standard error. Each mouse was infected i.p. with 5 ×10⁵ CFU of a 1:1 mixture of B. abortus wild type and virB mutant. Asterisks in the upper panels (A and C) denote a significant difference (P < 0.05) between geometric means of virB mutant and wt CFU as determined with Student's t test. Asterisks in the lower panels (B and D) indicate a significant difference between geometric means of CFU recovered from congenic control mice and mutant mice at each time point. (See text for details.)

