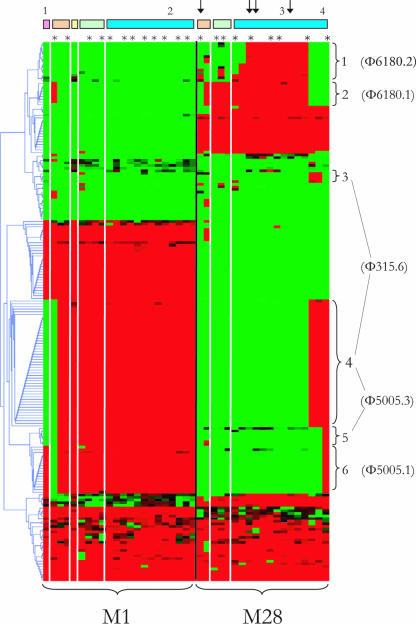
FIG. 1.
Two-dimensional hierarchical clustering, illustrating differential biomarkers in recent (isolated after 1980) and old (isolated before 1980) M1 and M28 strains. The GAS strains are arranged along the x axis by M type and year of isolation (except isolates from the 1990s, which are [given the short time span] clustered in the biomarker profile). Isolates associated with invasive GAS disease are indicated by asterisks. Isolates associated with noninvasive GAS disease are indicated by dashes. The dendrogram on the y axis shows the clustering of 203 differentiating biomarkers. Red represents the presence of a biomarker, and green represents the absence of a biomarker. The bars at the top show the decade of isolation for each M type, as follows: pink indicates isolates obtained in the 1950s, brown indicates isolates obtained in the 1960s, yellow indicates isolates obtained in the 1970s, green indicates isolates obtained in the 1980s and blue indicates isolates obtained in the 1990s. The arrows indicate strains with the emm28.0′′ allele. Braces indicate clusters of biomarkers, representing prophages. The numbering of the clusters corresponds to the numbering in Table 1.

