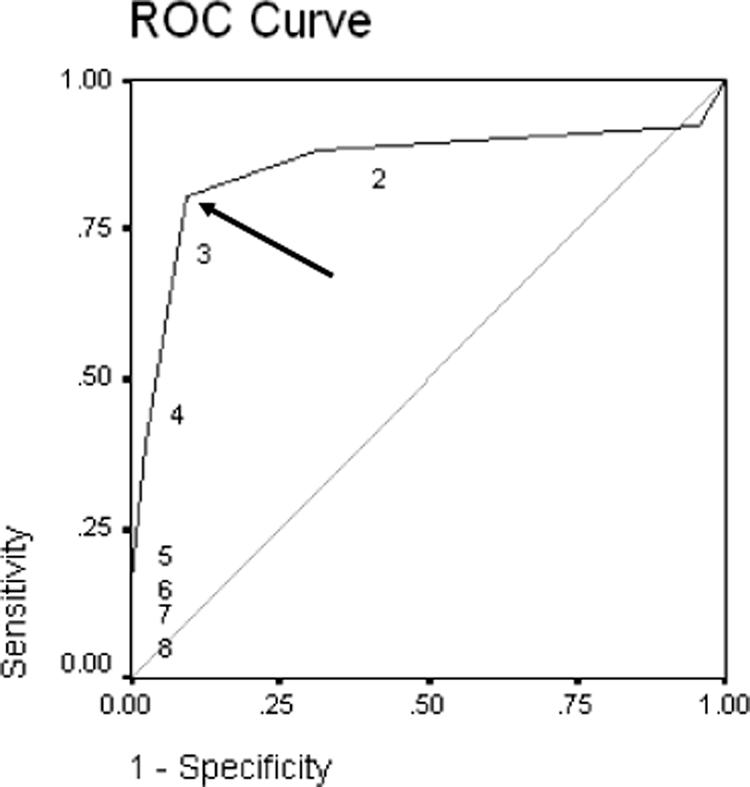
FIG. 1.

ROC curve for the antibiotic resistance profile of MRSA bloodstream isolates as a predictor of PFGE pattern (area under the ROC curve, 0.856; 95% CI, 0.775 to 0.936). The numbers in the figure refer to the number of antibiotic agents to which isolates expressed antibiotic resistance. A cutoff point of resistance to ≤2 classes for CG isolates and to ≥3 classes for HG isolates is seen; this cutoff point (arrow) maximizes the sensitivity and specificity of genotype prediction by antibiotic susceptibility pattern. With this cutoff, the likelihood ratio for an organism with resistance to less than three classes for a CG was 4.626 (95% CI, 3.007 to 7.025).
