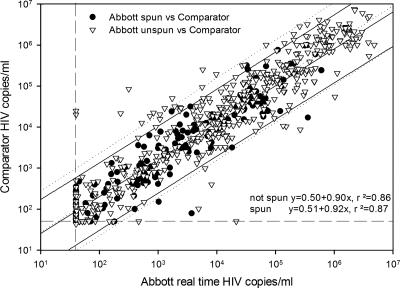
FIG. 1.
Comparison of data obtained from samples that were spun and those obtained from samples that were not spun. Triangles and dotted lines are data points and regression curves/95% confidence intervals, respectively, from samples that had been frozen at −80°C and that had not been spun before m1000 RNA extraction. Circles and solid lines are data points and regression curves/95% confidence intervals, respectively, from samples that were either used fresh or had been frozen at −80°C and subsequently spun before m1000 RNA extraction. Horizontal and vertical dashed lines are the lower limits of quantification.

