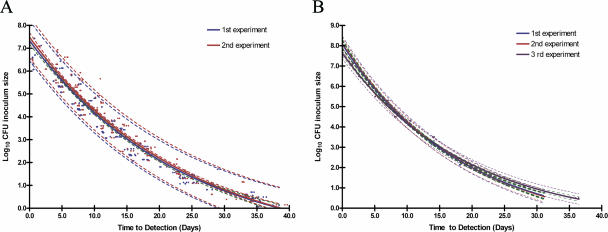
FIG. 3.
MGIT counting model reproducibility. (A) Correlation between observed and predicted CFU using the universal standard curve for 12 M. paratuberculosis strains repeated twice. (B) Correlation between observed and predicted CFU using the M. paratuberculosis ATCC 19698 strain-specific model repeated three times. The dotted lines with the same color for each standard curve and green dotted lines show 95% PIs and 95% CIs, respectively.

