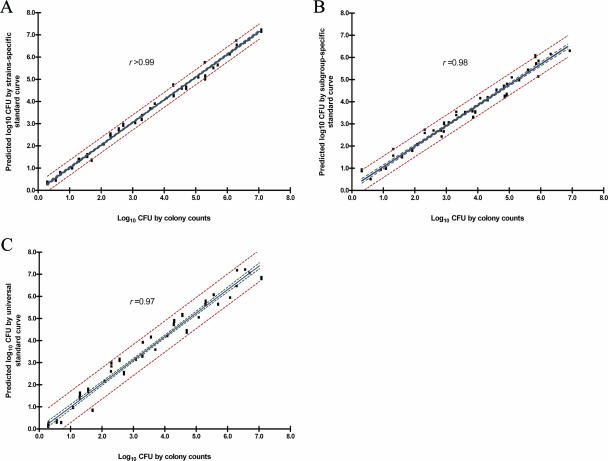
FIG. 5.
Correlation between actual CFU and predicted CFU. (A) Predictive CFU based on the strain-specific standard curves. (B) Predictive CFU based on the subgroup-specific standard curves. (C) Predictive CFU based on the universal standard curve. The red dotted lines and green dotted lines show 95% PIs and 95% CIs, respectively.

