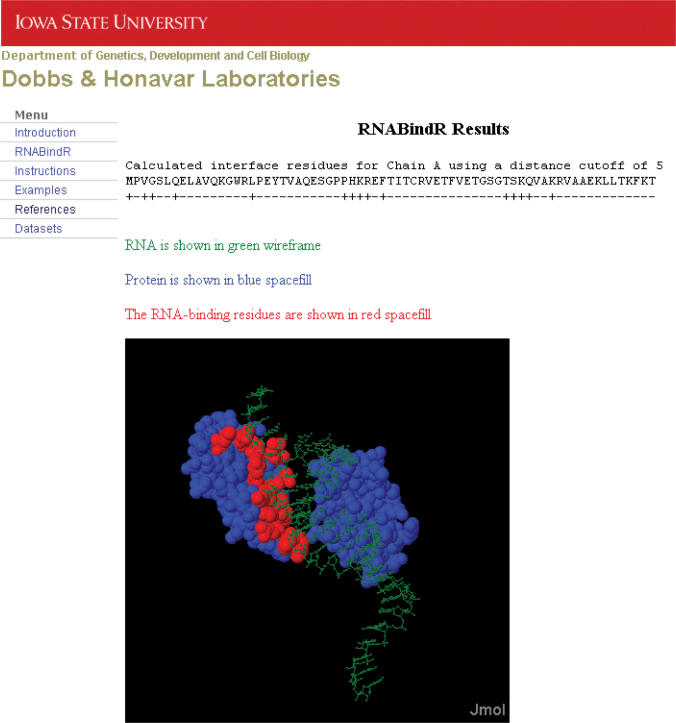
Figure 3.
Example of RNABindR results: identifying actual RNA-binding residues in a known protein–RNA complex. RNABindR output includes the amino acid sequence of the identified protein chain(s) in the complex, with a ‘+’ label for each interacting residue (those having atoms within the selected RNA contact cutoff distance) and ‘−’ for non-binding residues. Below, a Jmol applet displays the structure of the protein–RNA complex. RNA-binding residues are displayed in red space-fill, non-binding residues in blue space-fill and the RNA in green wireframe. Users can manipulate the image using the Jmol applet.

