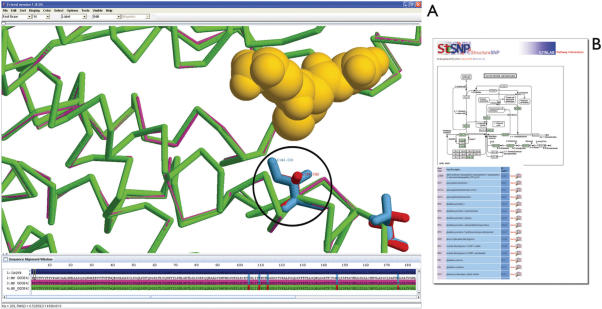
Figure 3.
(A) Glutathione S Transferase is shown with nsSNP locations displayed in ball and stick representation, with I105V marked with a black circle. The reference residues are shown in blue, nonsynonymous residues in red and the substrate glutathione is displayed in space fill representation (yellow). The query for the example was Protein ID NP_000843 and template PDB ID 1aqv chain B. (B) The Results section also provides a user with a link to glutathione metabolism in order to view other members found in the pathway.

