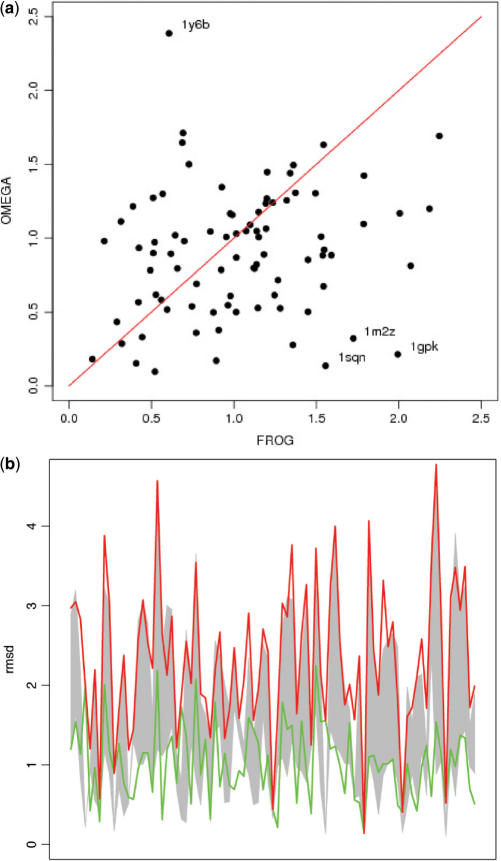
Figure 3.
(a) Deviation of the best conformation generated using Frog versus the best conformation generated by Omega, for series of up to 50 conformers. The best conformations are expressed in terms of RMS deviation to the experimental structure of the compound. The results are presented for the 85 protein-ligand crystal structures of the new Astex validation set (21). Labels identify some compounds with singular deviations (see text). (b) Diversity of the conformations generated by Frog and Omega for 85 compounds. Conformation deviations correspond to RMS deviation to the experimental structure of the compound. Omega: gray filled area; Frog: area between the red and green lines.

