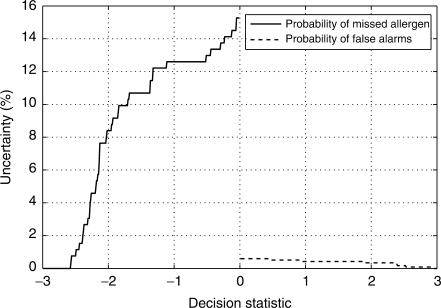
Figure 2.
Graph depicting the level of uncertainty depending on the decision statistic obtained from EVALLER assignment. The uncertainty is defined as the probability of an erroneous assessment assuming the decision threshold is set at the decision statistic instead of zero. Under this condition, the solid line illustrates the probability of neglecting an allergen when EVALLER assigns an amino acid sequence as a presumable non-allergen. The dashed curve illustrates the probability of obtaining a false alarm when EVALLER assigns an amino acid sequence as a presumable allergen.

