
Figure 5. Selection procedure for genes associated to survival times as risk factors.
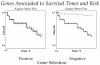
A positive gene (left plot) is that whose expression included as a risk factor in a survival model (cox, exponential, poison, etc.) can be fitted reasonably well (dotted line) to the original survival times (steep solid line). The predicted survival curve from a negative gene (dotted line in right plot) is not close to the observed survival curve (steep solid line).