
Figure 6. Selection procedure for genes associated to outcome.
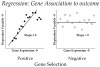
The expression of a positive gene (horizontal axis in left plot) is highly correlated with the associated outcome (vertical axis). For a non-associated gene (right plot), the gene expression (horizontal axis) is not correlated to outcome (vertical axis).