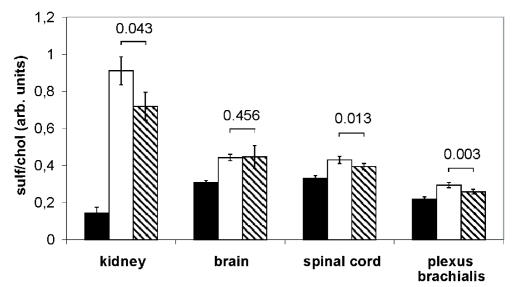
Figure 6.
Sulfatide levels after weekly injection of 2.5 mg/kg hASA into transgenic ASA−/−mice for 17 weeks (hatched bars; hASA serum levels < 0.01–1.70 μg/mL). Age-matched transgenic ASA−/− mice mock-treated with buffer (open bars) and untreated wildtype mice (closed bars) were used as controls. Sulfatide was quantified by TLC and normalized on cholesterol. Bars represent means ± SDs, n = 5–6. P values are indicated (Student t-test).

