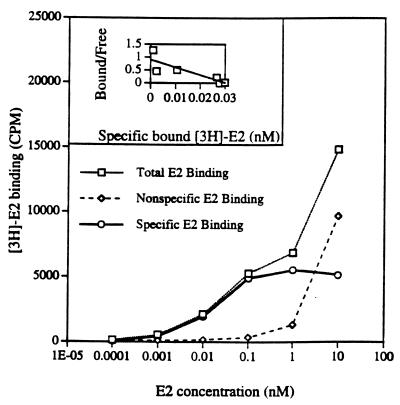
Figure 4.
E2 binding in PR1 cells. Whole cell [3H]E2 uptake assay was performed. Cells were allowed to bind increasing concentrations of [3H]E2 or [3H]E2 + 100-fold excess of unlabeled DES. [3H]E2 counts were used as total binding and [3H]E2 + 100-fold DES counts were used as nonspecific binding. Specific binding was calculated by subtracting the nonspecific count from the total count. The binding data were run in the ebda program to calculate Kd and Bmax. The binding curve shows that specific binding was saturable, whereas total and nonspecific binding were not. (Inset) Scatchard plot. By using Bmax, the total number of ER in PR1 cells were calculated.

