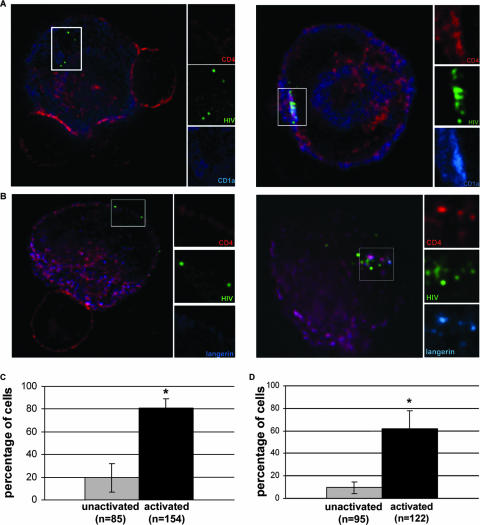
FIG. 7.
Association of CD1a and langerin in an MVB in activated LCs. (A) Deconvolution microscopy of DC-100 cells. Unsorted unactivated (left) and activated (right) DC-100 cells were incubated with X4-tropic HIV with RFP-Vpr (pseudocolored green) prior to coculture with CD4+ T cells. LCs were identified by positive staining for CD1a (blue) and CD4 (red), while T cells were only CD4 positive. The boxed area is enlarged and color separated to show individual stains. (B) DC-100 cells were treated as for panel A; however, LCs were identified by staining for langerin (blue). (C) Percentages of unactivated and activated LCs with CD1a associated with HIV. Error bars show standard errors of the means from four individual experiments; a P value of <0.05 is marked with an asterisk. (D) Percentages of cells with langerin associated with HIV in unactivated and activated LCs. Error bars show standard errors of the means from four individual experiments; a P value of <0.05 is marked with an asterisk.

