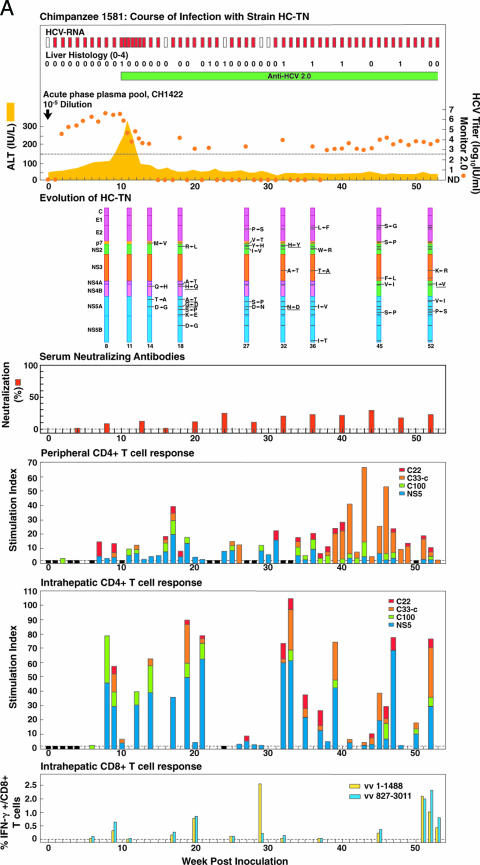
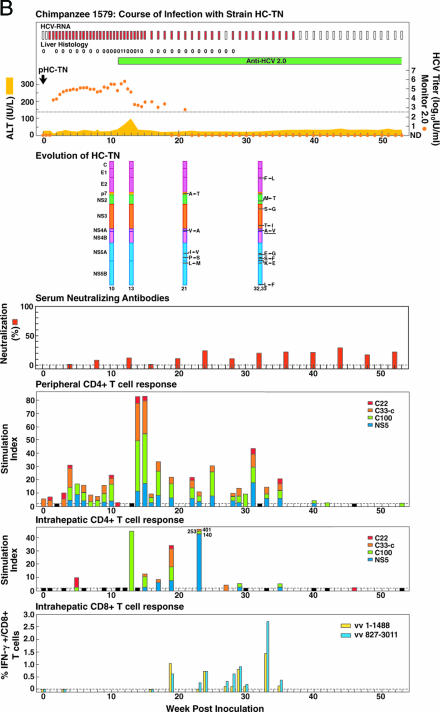
FIG. 3.
Course of infection, viral evolution, and immune responses in (A) CH1581 and (B) CH1579, which were infected with HCV strain HC-TN (quasipolyclonal and monoclonal infections, respectively). See the legend for Fig. 1 for the details of the course of infection. Representing the evolution of HC-TN, the HC-TN genome is shown as a vertical bar with the core (C) at the top and NS5B at the bottom. Solid black lines with capital letters indicate new amino acid changes that were identified when a sequence was compared with the sequence obtained at the previous time point. Underlined capital letters indicate mutations that had occurred by one time point but had changed back to the original sequence by the next time point analyzed. Solid black lines without capital letters represent amino acid changes that persisted. The week the sequence was analyzed is indicated at the bottom of each genome. For neutralizing antibodies, the percent neutralization of retroviral pseudovirus particles bearing the HCV envelope proteins (>50% was considered significant) is shown. The peripheral and intrahepatic CD4+ T-cell responses to core (red), NS3 (orange), NS3-NS4 (green), and NS5 (blue) are shown as specific SI. A specific SI of >2 was considered significant. At weeks tested in which the SI was ≤2 against all four antigens, the negative result is indicated by a black bar (with a value of 2). The intrahepatic CD8+ T-cell response is represented as the percentage of intrahepatic CD8+ T cells that produced gamma interferon (IFN-γ) after stimulation with transiently expressed HCV proteins, as described in Materials and Methods. vv 1-1488, vaccinia virus vHCV(1-1488); vv 827-3011, vaccinia virus vHCV(827-3011).


