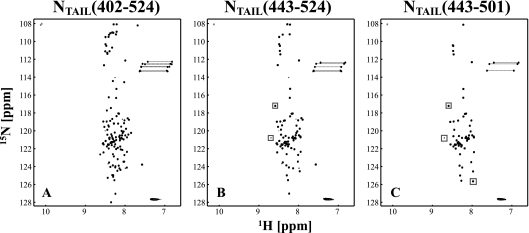
FIG. 3.
2D 1H-15N HSQC of (A) SeV NTAIL, (B) NTAIL(443-524), and (C) NTAIL(443-501) recorded at 25°C on a 600-MHz spectrometer. Positive contour levels are presented in black and negative contour levels in gray. The two negative signals around 108 ppm in the nitrogen dimension are folded signals that resonate around 129 ppm. Dashed lines connect the two signals from the Asn and Gln side-chain NH2 groups. The spectra are typical for a disordered protein, and the spectra of the different constructs superimpose perfectly. The few peaks that do not superimpose are indicated by gray boxes and presumably correspond to residues at the boundaries of the constructs.

