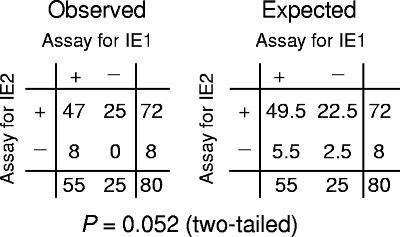
FIG. 4.
Correlation analysis. The binary transcription-on and transcription-off data (dichotomous variables) derived from Fig. 3 were arranged in a two-by-two contingency table (Observed) and compared with those in the table expected for independent distribution (null hypothesis) of IE1 and IE2 transcription (Expected). Fisher's exact test was used to calculate the two-tailed P value (method of the sum of small P values) following the recommendations provided by Simple Interactive Statistical Analysis (2, 45). The variables are considered to be positively correlated only if the P value is <0.01 and under the condition that the number of double positives observed is greater than the number of double positives expected, both of which were not fulfilled. The hypothesis of independent distribution cannot be rejected if P is >0.05, which was the case.

