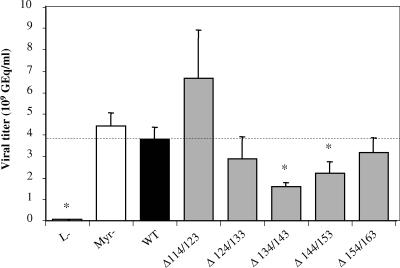
FIG. 2.
Viral titers of inocula determined by quantitative PCR analysis of viral DNA. Results are expressed in GEq per ml of inoculum. The two controls, L− and Myr−, consist of HBV with the L protein deleted, impairing virion production, and of HBV with an unmyristoylated L protein, resulting in the production of noninfectious viruses, respectively. Mutant viruses, with deletions in the pre-S2 domain, are identified as Δx/y. Statistical analysis was performed by the Mann-Whitney test; significant differences compared to the WT condition are indicated by asterisks (P < 0.05). The dotted horizontal line indicates the level of the WT condition.

