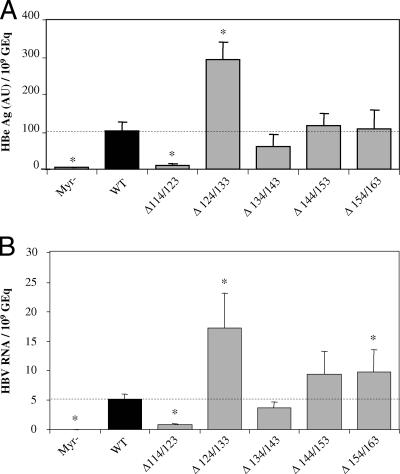
FIG. 3.
Infectivity of mutant and WT viruses. The infectivity is expressed as a ratio between the level of infection markers (HBe or HBV RNA) and the number of GEq used for infection. The control Myr− is described in the legend to Fig. 2. Mutant viruses with deletions in the pre-S2 domain are identified as Δx/y. Statistical analysis was performed using the Mann-Whitney test; significant differences compared to the WT condition are indicated by asterisks (P < 0.05). The dotted horizontal line indicates the level of the WT condition. (A) Infection was assessed by measuring HBeAg in the culture supernatant of infected cells 10 days postinfection. One arbitrary unit (AU) corresponds to the HBe concentration in the positive control of the assay kit. (B) Infection was assessed by measuring intracellular viral RNA by Q-PCR after reverse transcription 10 days postinfection. Expression data are normalized to 18S rRNA, and the relative viral RNA expression levels are calculated according to the ΔΔCt (comparative Ct) method (Applied Biosystems user bulletin 2 on relative quantification of gene expression) in which the reference corresponds to the WT condition.

