FIG. 1.
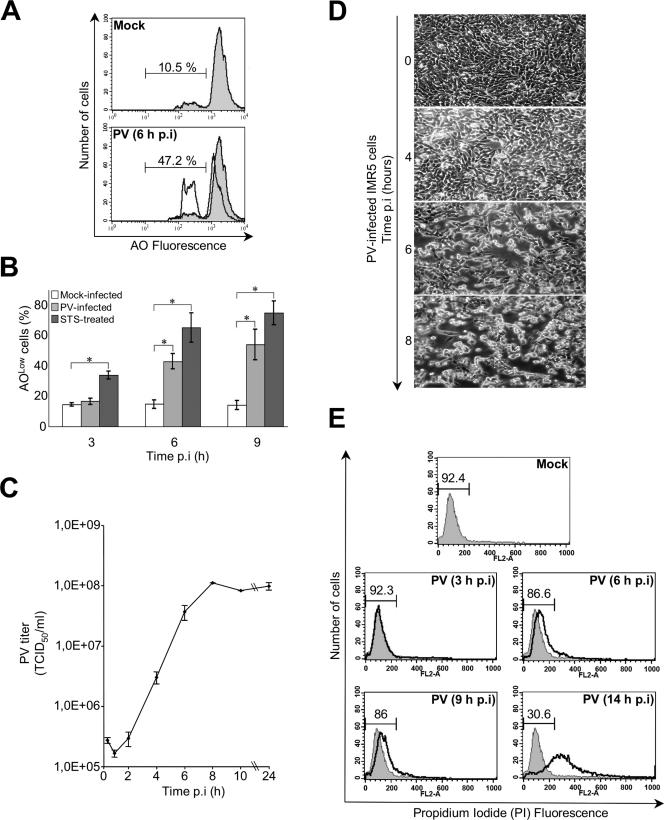
PV-induced apoptosis in neuronal cells. (A) Representative flow cytometric histograms after AO nuclear dye staining of mock-infected and PV-infected (6 h p.i.) IMR5 cells. The profiles of mock-infected control cells (gray area) and PV-infected cells (blank area) are shown. The percentages of apoptotic cells corresponding to a reduced fluorescence intensity (AOLow) for each of the two experimental conditions are indicated. (B) Flow cytometric analysis of PV-induced apoptosis. Mock-infected, PV-infected, and STS-treated IMR5 cells were analyzed at the indicated times p.i. by flow cytometry after AO staining, and the percentages of AOLow cells are shown in white, light gray, and dark gray, respectively. The graph shows the mean percentages of apoptotic cells in three independent experiments. Error bars represent the standard errors of the means. *, P < 0.05 by Student's t test comparing PV-infected and STS-treated IMR5 cells to mock-infected IMR5 cells. (C) One-step growth curve of PV in IMR5 cells. Cells and supernatants were harvested at the indicated times p.i. and subjected to three cycles of freezing and thawing. Total virus yields were determined by TCID50 assay. Each point represents the mean virus titer for three independent experiments. Standard errors of the means are indicated. (D) Kinetics of cytopathic effect in PV-infected IMR5 cells. Cells were visualized by light microscopy at the indicated times p.i. Magnification, ×150. (E) Assessment of plasma membrane integrity. Flow cytometry histograms produced after staining of mock- and PV-infected IMR5 cells with PI at the indicated times. PI cannot enter cells with intact plasma membranes. When the plasma membranes are disrupted, cells become permeable to PI. The percentages of cells with intact membranes are indicated. Diagrams representative of two experiments are shown.

