
Figure 2.
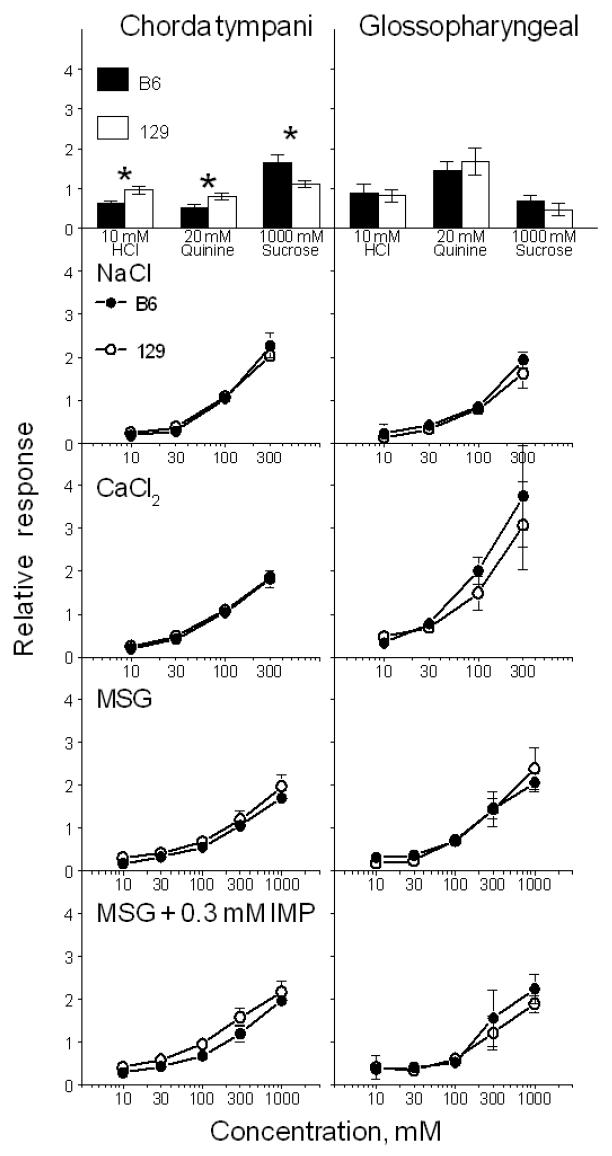
Chorda tympani (left) and glossopharyngeal (right) nerve responses (relative to 100 mM NH4Cl) in B6 (filled bars and circles) and 129 (open bars and circles) mice (Experiment 1). Means ± Standard Errors. *Significant difference between the B6 and 129 strains, p < 0.05, t-tests.