Fig. 2.

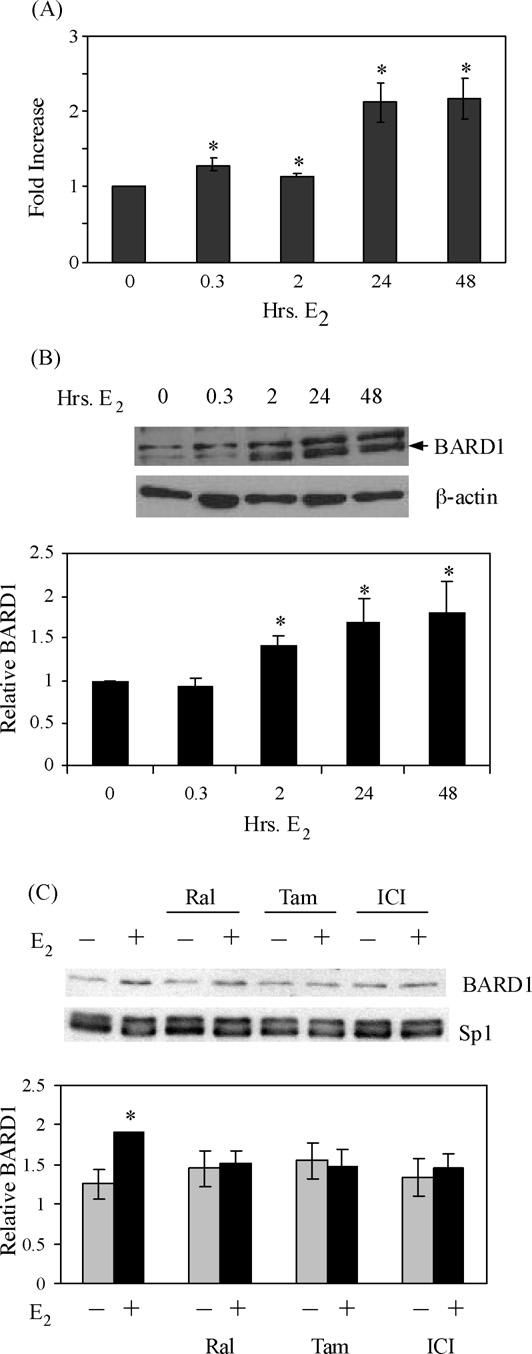
BARD1 mRNA and protein levels increase when MCF-7 cells are exposed to E2. MCF-7 cells were treated with ethanol vehicle, 10 nM E2 or 100 nM raloxifene (Ral), tamoxifen (Tam), or ICI 182,780 (ICI) as indicated. (A) RNA was isolated and utilized in quantitative real time PCR experiments to determine the levels of BARD1 and 36B4 mRNA. Values were calculated using the ΔΔCt method, which was normalized to 36B4 mRNA levels. Data from three independent experiments were combined and are expressed as the mean-fold increase in BARD1 mRNA levels ± S.E.M. Student's t-tests revealed that samples from MCF-7 cells that had been treated with E2 were statistically different (indicated by an asterisk) from cells that had been treated with ethanol (p ≤ 0.05). (B and C) Whole cell extracts from MCF-7cells that had been treated as indicated were subjected to Western analysis with BARD1 antibody or control β-actin- or Sp1-specific antibody. Each blot shown is representative of three independent experiments. Combined, normalized data is shown graphically as the relative BARD1 protein level (mean ± S.E.M.). Asterisks indicate significant increases in BARD1 protein levels compared to ethanol control (p ≤ 0.05). Error bars are sometimes too small to be visualized.
