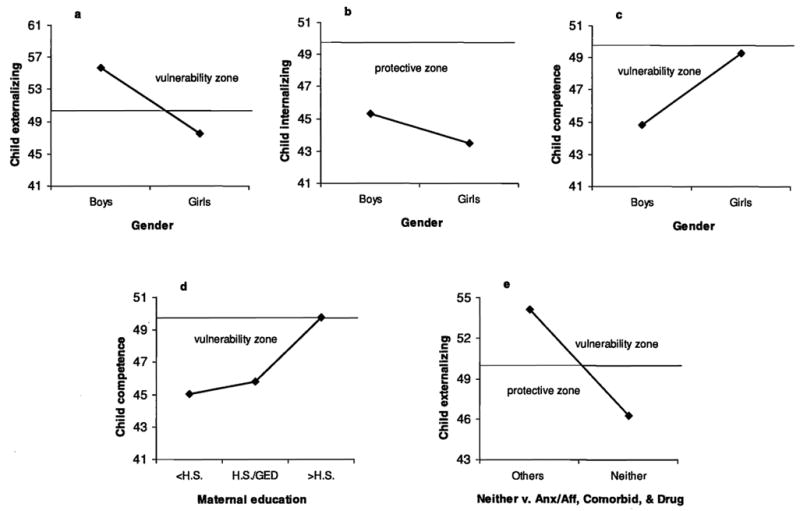
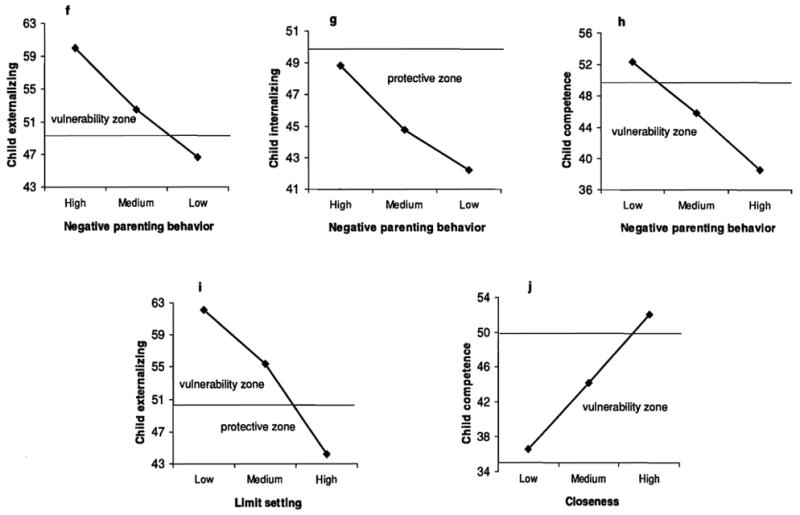
Figure 2.


The associations of maternal psychiatric contrasts and vulnerability and protective indices with child adjustment outcomes. Lines indicate average symptom levels according to clinically established norms (T score = 50); SD = 10.


The associations of maternal psychiatric contrasts and vulnerability and protective indices with child adjustment outcomes. Lines indicate average symptom levels according to clinically established norms (T score = 50); SD = 10.